Many signals. One decision.
Prices only make sense alongside the context.
INDEPENDENT CONCEPT / 2026
A desktop and VR trading ecosystem that explores how equity dealers could keep essential market context within reach, beyond a fixed desk.
Arrange your workspace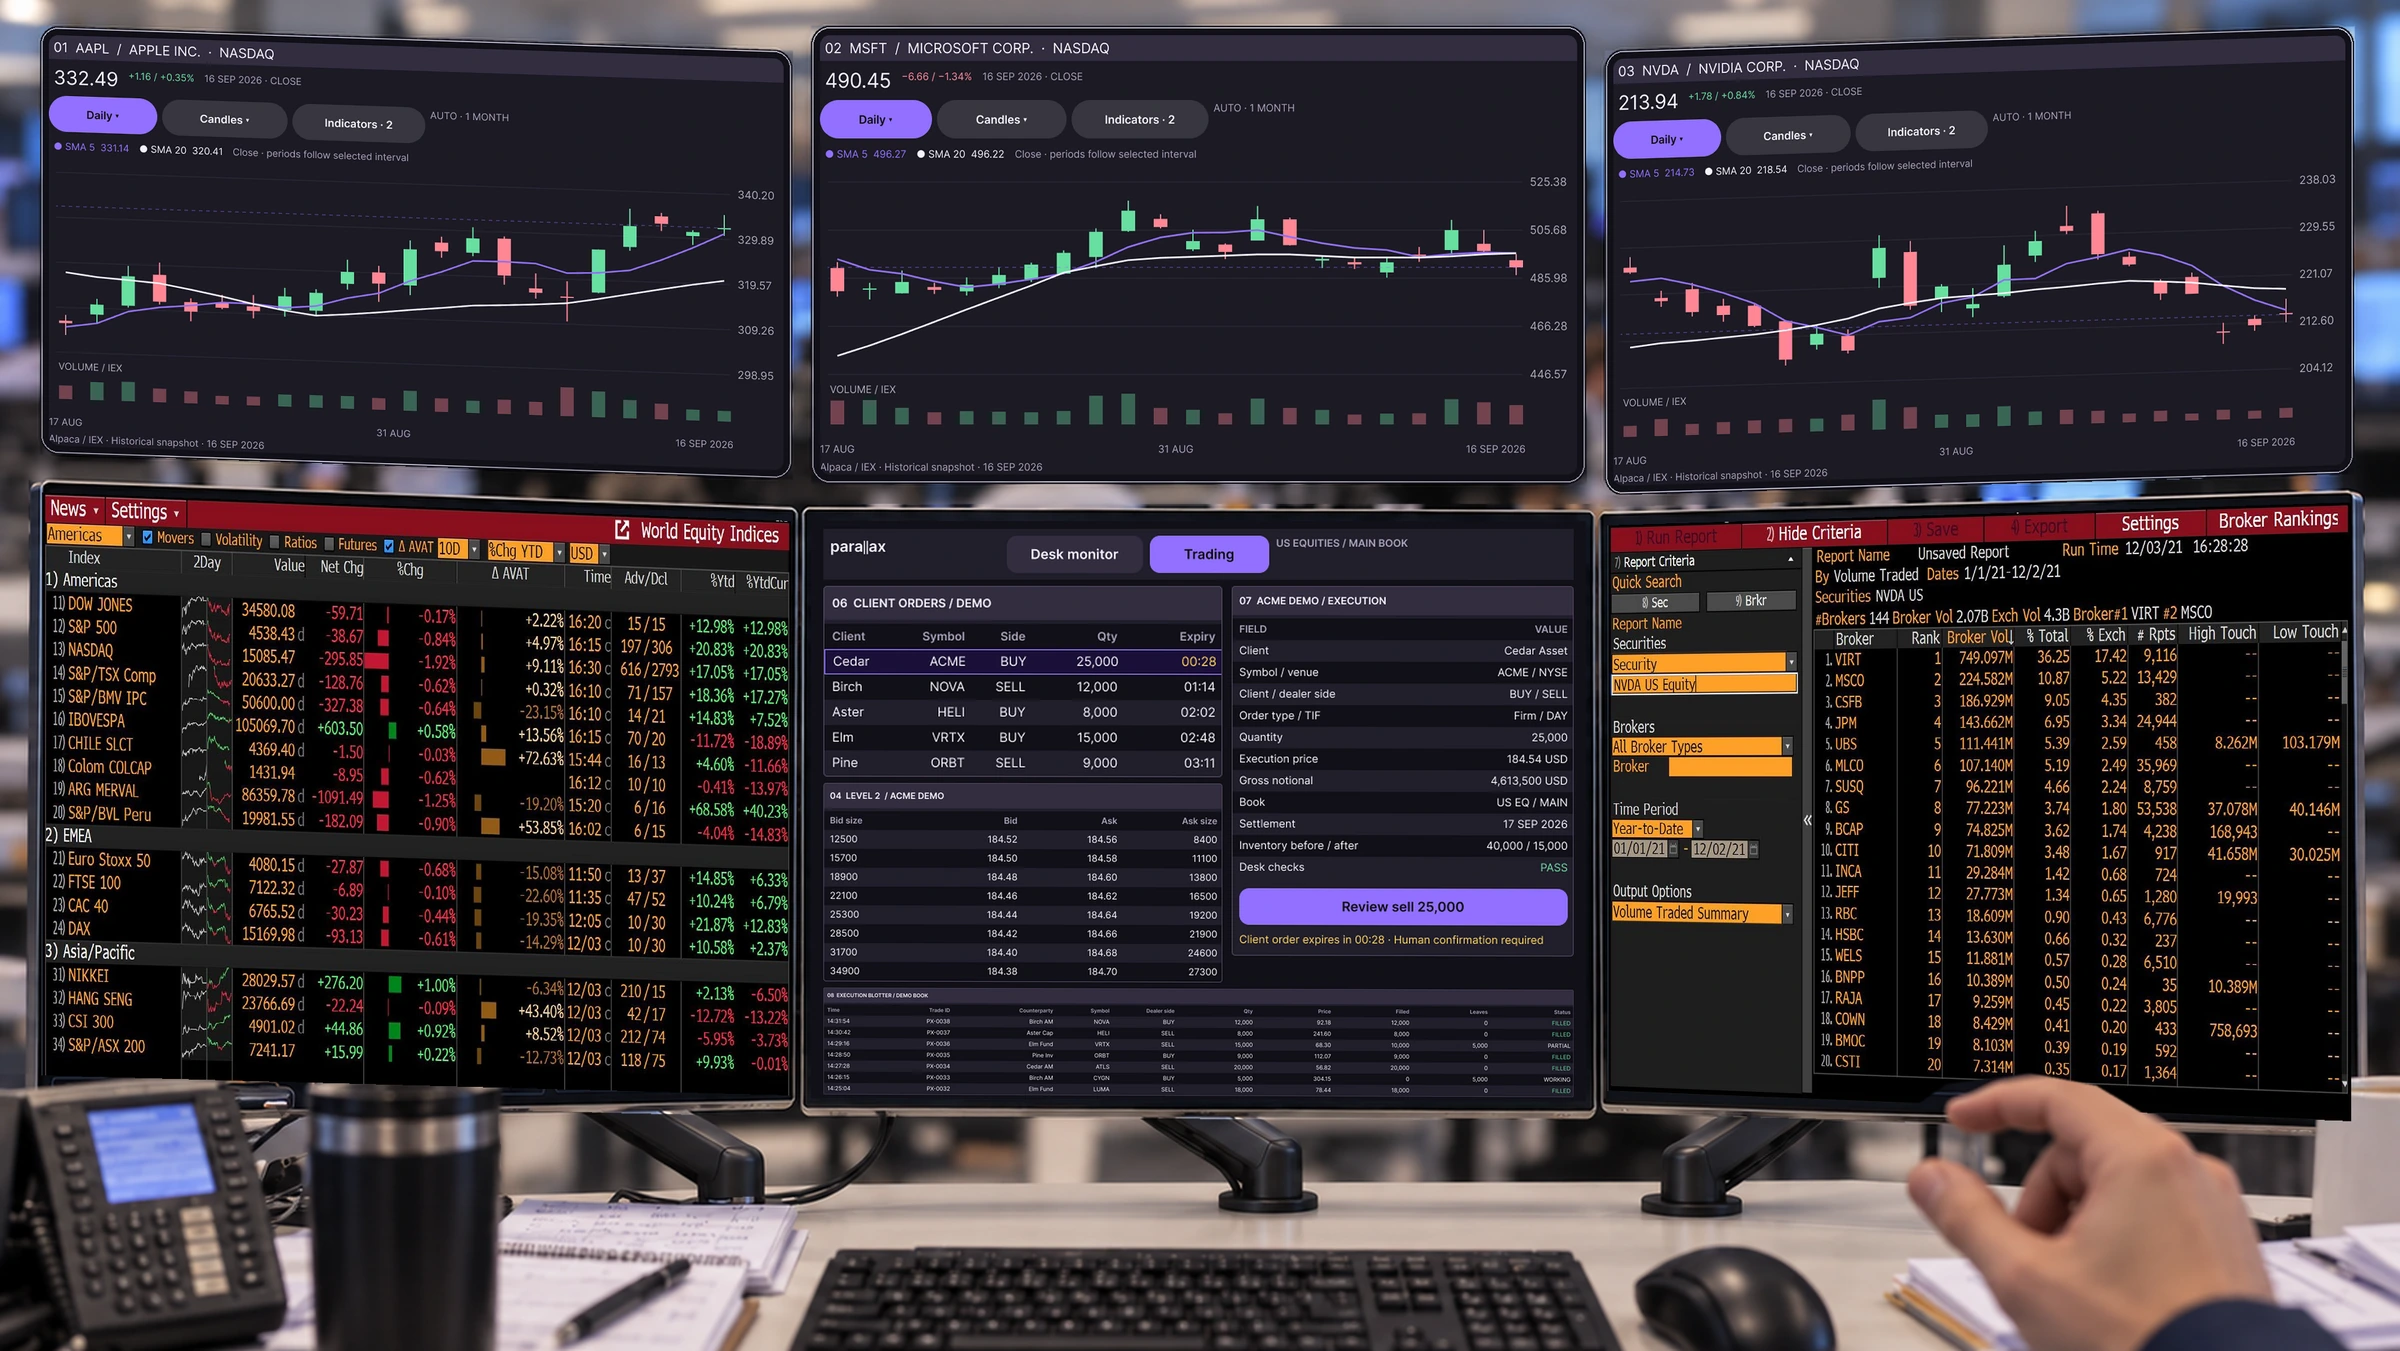
Desktop + VR · Three physical monitors, three spatial analysis panels · Concept visualization
01 / THE PROBLEM
A dealer connects many signals. That context is still anchored to a desk.
Prices only make sense alongside the context.
Inspect a detail without losing the wider view.
The continuity gap this concept explores.
Design premise to investigate: continuity across views and locations. Multiple monitors are not inherently the problem; the benefit of VR remains to be validated.
02 / THE CONCEPT
Desktop keeps execution close at hand. VR adds room for parallel analysis: three independent stock charts above the existing Bloomberg and Parallax monitors. A spatial workspace can also gather the primary task and supporting context into floating panels.
If essential panels retain a recognizable structure across desktop and VR, a dealer may be able to recover context with less searching after a change of view.
The concept explores composition and navigation. Headset comfort, panel manipulation, and safe use away from the desk remain untested.
02.1 / THE SPATIAL WORKSPACE
One central chart. Two inward-facing wings. A workspace that surrounds the dealer instead of fitting inside a monitor.
| Date | Close | Chg % |
|---|---|---|
| 10/14 | 769.65 | -1.08% |
| 10/13 | 778.03 | 0.00% |
| 10/12 | 778.03 | -0.06% |
| 10/09 | 778.51 | 0.60% |
| 10/08 | 773.88 | -0.42% |
| 10/07 | 777.15 | -0.25% |
| 10/06 | 779.10 | 0.53% |
| 10/05 | 774.97 | 0.69% |
| 10/02 | 769.65 | 0.73% |
| 10/01 | 764.10 | 0.23% |
| Orders | Bid size | Bid | Ask | Ask size | Orders |
|---|---|---|---|---|---|
| 4 | 25,000 | 184.52 | 184.56 | 28,400 | 3 |
| 5 | 18,000 | 184.50 | 184.58 | 21,400 | 4 |
| 6 | 8,000 | 184.48 | 184.60 | 11,400 | 5 |
| 7 | 15,000 | 184.46 | 184.62 | 18,400 | 6 |
| Client | Symbol | Side | Qty |
|---|---|---|---|
| Cedar | ACME | BUY | 25,000 |
| Birch | NOVA | SELL | 18,000 |
| Aster | HELI | SELL | 8,000 |
| Elm | VRTX | BUY | 15,000 |
| Pine | ORBT | SELL | 5,000 |
| Oak | ATLS | SELL | 12,000 |
Available inventory 15,000
Additional locate 10,000 required
Limit validation Within range
Review status Pending
| Time | Trade ID | Client | Symbol | Side | Quantity | Price | Filled | Leaves | Status |
|---|---|---|---|---|---|---|---|---|---|
| 14:31:54 | PX-0038 | Cedar | ACME | BUY | 25,000 | 184.54 | 20,000 | 5,000 | WORKING |
| 14:30:54 | PX-0037 | Birch | NOVA | SELL | 12,000 | 186.84 | 12,000 | 0 | FILLED |
| 14:29:54 | PX-0036 | Aster | HELI | BUY | 8,000 | 189.14 | 8,000 | 0 | FILLED |
| 14:28:54 | PX-0035 | Elm | VRTX | SELL | 15,000 | 191.44 | 10,000 | 5,000 | WORKING |
| 14:27:54 | PX-0034 | Pine | ORBT | BUY | 5,000 | 193.74 | 5,000 | 0 | FILLED |
| 14:26:54 | PX-0033 | Oak | ATLS | SELL | 12,000 | 196.04 | 12,000 | 0 | FILLED |
| 14:25:54 | PX-0032 | Cygnus | CYGN | BUY | 18,000 | 198.34 | 13,000 | 5,000 | WORKING |
02.2 / AN INTERACTIVE WORKSPACE
A fixed screen layout cannot fit every task. Bring the chart closer, keep news at the edge, or put three stocks side by side. The workspace changes around what you need to see.
Try it below: a wider chart reveals more daily candles; a taller news panel reveals more stories. Wider tables add detail, while narrower panels keep the essentials. Move, resize, and combine the views around your task.
Drag headers to move. Drag a lower-right corner to change width and height independently. Scroll over a chart to zoom; hover to inspect time and price. Double-click to reset. Content adapts to the space. Keyboard: focus a header, then use arrow keys; hold Shift to resize. On smaller screens, swipe the empty canvas to explore.
Analysis workspace ready.Choose the bar interval, toggle an indicator, or zoom. Active controls show exactly which view you are reading.
Free placement handles the current task. Settings define the starting view: density, chart defaults, indicators, and visible panels.
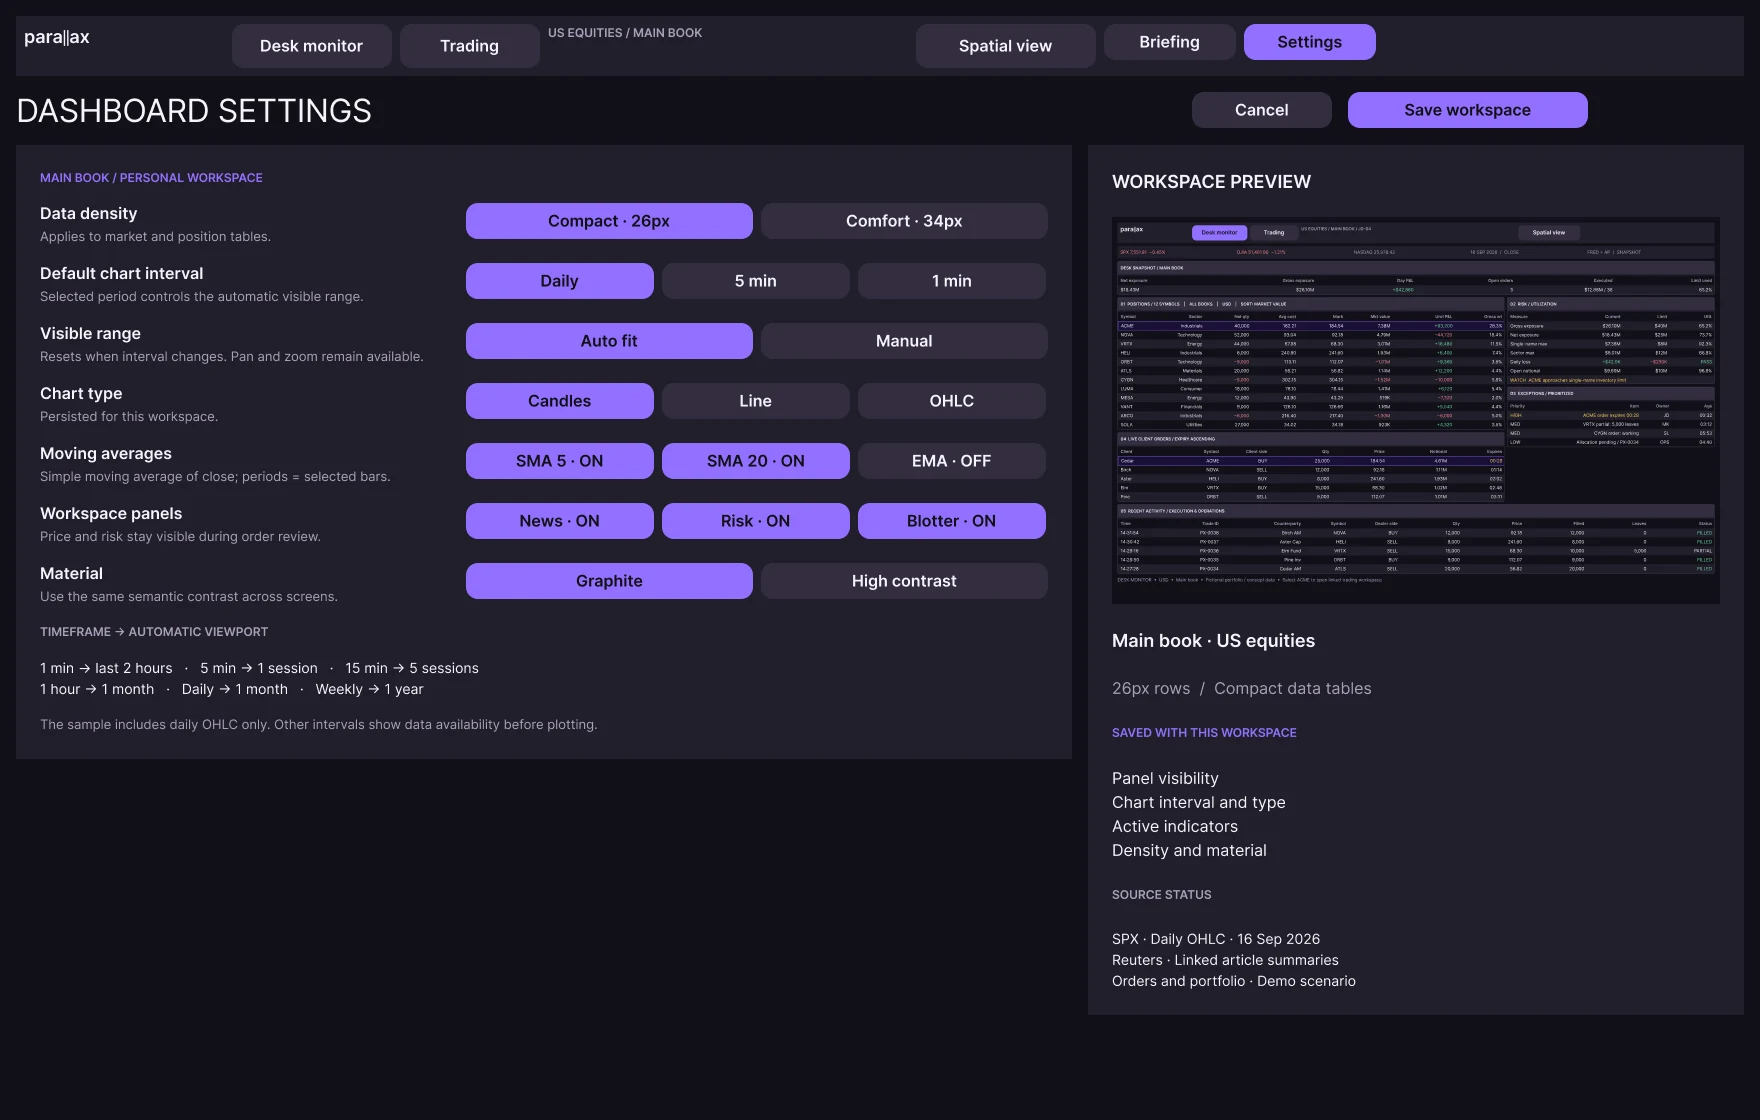
A browser exploration of adaptive panel arrangement. Interface elements reflow at a consistent type size. Interactive charts use historical Alpaca / IEX data through October 14, 2026. Choose 1, 5, 15, or 30-minute bars; 1, 2, or 4-hour bars; or daily bars. Intraday views use 09:30–16:00 New York time. The benchmark is the SPY ETF; the Reuters archive covers September 15–16. IEX volume represents one exchange. Headset depth, reach, and comfort still need validation.
02.3 / DESKTOP TO SPATIAL
The first direction felt too close to a consumer investing app. I replaced large summary cards with an expert workspace: compact tables, persistent context, clear panel labels, and an execution ticket beside the market view.
Desktop and VR retain the same information density. The same charts, tables, and order context move from a flat layout into depth; content is not removed to make the view feel spatial.
| Date | Close | Chg % |
|---|---|---|
| 10/14 | 769.65 | -1.08% |
| 10/13 | 778.03 | 0.00% |
| 10/12 | 778.03 | -0.06% |
| 10/09 | 778.51 | 0.60% |
| 10/08 | 773.88 | -0.42% |
| 10/07 | 777.15 | -0.25% |
| 10/06 | 779.10 | 0.53% |
| 10/05 | 774.97 | 0.69% |
| 10/02 | 769.65 | 0.73% |
| 10/01 | 764.10 | 0.23% |
| Orders | Bid size | Bid | Ask | Ask size | Orders |
|---|---|---|---|---|---|
| 4 | 25,000 | 184.52 | 184.56 | 28,400 | 3 |
| 5 | 18,000 | 184.50 | 184.58 | 21,400 | 4 |
| 6 | 8,000 | 184.48 | 184.60 | 11,400 | 5 |
| 7 | 15,000 | 184.46 | 184.62 | 18,400 | 6 |
| Client | Symbol | Side | Qty |
|---|---|---|---|
| Cedar | ACME | BUY | 25,000 |
| Birch | NOVA | SELL | 18,000 |
| Aster | HELI | SELL | 8,000 |
| Elm | VRTX | BUY | 15,000 |
| Pine | ORBT | SELL | 5,000 |
| Oak | ATLS | SELL | 12,000 |
Available inventory 15,000
Additional locate 10,000 required
Limit validation Within range
Review status Pending
| Time | Trade ID | Client | Symbol | Side | Quantity | Price | Filled | Leaves | Status |
|---|---|---|---|---|---|---|---|---|---|
| 14:31:54 | PX-0038 | Cedar | ACME | BUY | 25,000 | 184.54 | 20,000 | 5,000 | WORKING |
| 14:30:54 | PX-0037 | Birch | NOVA | SELL | 12,000 | 186.84 | 12,000 | 0 | FILLED |
| 14:29:54 | PX-0036 | Aster | HELI | BUY | 8,000 | 189.14 | 8,000 | 0 | FILLED |
| 14:28:54 | PX-0035 | Elm | VRTX | SELL | 15,000 | 191.44 | 10,000 | 5,000 | WORKING |
| 14:27:54 | PX-0034 | Pine | ORBT | BUY | 5,000 | 193.74 | 5,000 | 0 | FILLED |
| 14:26:54 | PX-0033 | Oak | ATLS | SELL | 12,000 | 196.04 | 12,000 | 0 | FILLED |
| 14:25:54 | PX-0032 | Cygnus | CYGN | BUY | 18,000 | 198.34 | 13,000 | 5,000 | WORKING |
03 / BRAND & VISUAL SYSTEM
Parallel views become a paired letterform. Violet marks interaction, while market and status colors keep their own roles. The identity stays familiar as the workspace changes shape.
#9270FF1D · Selected#68DFA0↑ +0.85%#FF8794↓ −0.45%#FFD45C! Review required#111018Panel #211E2BHeader #36303FOne family for navigation, market data, and dense tables.
Regular 400 / Medium 500 / Semibold 600184.54 25,000 +0.85%SMA 5 SMA 20
SMA 5 SMA 20
The same mark, selection color, type, and header hierarchy carry across both surfaces.
04 / WHAT THIS PROJECT DEMONSTRATES
Parallax connects brand identity, dense desktop UI, spatial composition, and a hands-on exploration of free panel arrangement. Its outcome is a visual and interaction concept—not evidence of faster trading or a production-ready execution system.
Context recovery during view changes, chart-state recognition, and error rates in trade review. Headset sessions would also test text legibility, reach, neck movement, and fatigue.
Market charts use a dated reference snapshot. Orders, positions, and depth are demo scenarios. Panel movement, independent width and height, and responsive content work in this browser demo. Headset tracking, spatial depth, and real trade execution are outside this project’s scope.